ARTÍCULO |
The effect of drug loading in different type of lipid formulation and the fate of paclitaxel after dispersion in aqueous media
Kazi Mohsin, Fars Alanazi
Kayyali Chair for Pharmaceutical Industries, King Saud University, Riyadh, Saudi Arabia.
Recibido el 31 de octubre de 2011.
e-mail: mkazi@ksu.edu.sa
ABSTRACT
The purpose of the study is to investigate the effect of drug loading in representative types of lipid formulations and how drug kinetically precipitates from lipid-based systems following dispersion in aqueous media. A lipophilic model drug, paclitaxel was formulated in representative Type II, III & IV lipid delivery systems (SEDDS, SMEDDS & SNEDDS designed for oral administration) using oils and surfactants as excipients. Equilibrium solubilities of the drug were determined in mixtures equivalent to diluted formulations to examine the possibility of precipitation on dispersion. These data were compared with drug precipitation data obtained in dynamic dispersion experiments. Precipitation kinetics was measured over time after 1/100 dilution of formulations in aqueous media. Paclitaxel was highly soluble in Type III & IV systems (contain high quantity of hydrophilic materials) in compared with Type II systems. Aqueous dispersion of Type II typically maintained drugs in a metastable state for several hours. Formulations with higher content of hydrophilic materials (Type III or Type IV) resulted in more rapid precipitation. In dynamic experiments, the results indicated that most of the lipid systems were supersaturated with respect to the drug on dilution, but the more lipophilic formulations were found to be more suitable for paclitaxel. In particular the study suggests that Type III or Type IV formulation may be unsuitable eventhough they solubilise paclitaxel considerably. |
Key words: Emulsifying; Microemulsifying; Drug delivery systems; SEDDS; SMEDDS.
RESUMEN
Efecto de la introducción de fármacos en diferentes formulaciones de lípidos y estudio de liberación del paclitaxel después de su dispersión en medio acuoso
El propósito del estudio es investigar el efecto de la introducción de fármacos tipos, representativos de formulaciones de lípidos y cómo el fármaco cinéticamente precipita dentro de sistemas basados en lípidos, después de su dispersión en medios acuosos. Un modelo lipófilo, el paclitaxel fue formulado en los sistemas representativos tipo II, III y IV de lípidos (SEDDS, SMEDDS y SNEDDS diseñados para su administración oral), utilizando aceites y tensioactivos como excipientes. La solubilidad en el equilibrio del fármaco, se determinó en mezclas equivalentes a formulaciones diluidas, para examinar la posibilidad de su precipitación en dispersión. Estos datos, fueron comparados con los obtenidos en los experimentos de dispersión dinámica de precipitación de fármacos. La cinética de precipitación se midió con respecto al tiempo, después de una dilución al 1/100 en medio acuoso. El Paclitaxel resultó muy soluble en los sistemas tipo III y IV (que contienen gran cantidad de materiales hidrofílicos) en comparación con los sistemas de tipo II. La dispersión acuosa de tipo II, normalmente mantiene a los fármacos en un estado metaestable durante varias horas. Formulaciones con mayor contenido de materiales hidrofílicos (tipo III o tipo IV) dieron lugar a una precipitación más rápida. En experimentos dinámicos, los resultados indican que la mayoría de los sistemas de lípidos se súper saturaron con respecto al fármaco en dilución, pero las formulaciones más lipófilas resultaron ser más convenientes para el paclitaxel. En particular, el estudio sugiere que las formulaciones de tipo III o IV pueden ser inadecuadas aunque solubilicen en gran medida al paclitaxel. |
Palabras clave: Emulsión; Microemulsión; Sistemas de liberación de fármacos; SEDDS; SMEDDS.
1. introducTIOn
Lipid-based dosage forms have gained high priority and become more prominent in recent years in the pharmaceutical industry. Lipids have been used as carriers in various delivery systems for drug administration, including solutions, suspensions, emulsions, self-emulsifying systems and microemulsions (1-4) that are designed to increase solubility and bioavailability of drugs belonging to the BCS Class II and IV (5). Despite the potential that lipid formulation technology has for addressing challenging formulation issues, research and development activities in this area have been limited and to date only a few marketed products have employed lipid formulation strategies. A clear understanding of the characteristics of lipid excipients and their performance in formulations is desirable to rank and select suitable excipients in formulation development.
Over the last few decades, between 50% and 70% of all new chemical entities (NCE’s) has been known as poorly aqueous-soluble in the drug discovery programs (6). These NCE’s, which are lipophilic molecules, thus present great challenge to the formulators due to their erratic absorption from the gastrointestinal tract (GIT) following oral administration (6). The establishment of the likely human dose is an important step to identify the potential impact of limited solubility on the product development. To date, several formulation techniques have been established to enhance the equilibrium solubility of such non-polar drugs in aqueous vehicles (7-9).
In recent years, to facilitate the identification of the most appropriate formulations for specific drugs (i.e. with reference to their physicochemical properties), the Lipid Formulation Classification Systems (LFCS) has been discussed more widely within the pharmaceutical industry (10, 11). The LFCS can be adopted as a framework for comparing the performance of lipid-based formulations. In practice it is not always easy to physically distinguish between LFCS Types II, III and IV; except that the expectation is that particle size will be increasingly fine in the numerical order they are presented (12).
Amongst several approaches, which are currently available to incorporate active pharmaceutical drugs into lipid vehicles resulting in a variety of dosage forms, SEDDS and or SEMDDS have proved to be the most successful approaches in improving the bioavailability of the hydrophobic compounds. SEDDS/SMEDDS are formulated with mixtures of lipid vehicles and non-ionic surfactants in the absence of water, and are assumed to exist as transparent isotropic solutions. These systems advantageously present the drug in dissolved form and their relatively smaller droplet size provides a large interfacial area enhancing the activity of pancreatic lipase to hydrolyse TG and thereby promoting faster release of the drug and/or formation of mixed micelles of bile salts containing the drug (13-15). Since dissolution process is a rate-limiting step for poorly water-soluble drugs in the GI absorption, surfactants can lower surface tension and improve their dissolution in aqueous media (16-18). The development of Neoral® (cyclosporin A) as a commercial product, exhibits an excellent example of the utilization of these systems.
The current research involves both the basic and development aspects on the relationship between the type of lipid formulation, as defined by the LFCS, and the fate of paclitaxel formulated in lipid systems for oral delivery.
Efforts to develop oral formulations containing sufficient quantities of lipid and surfactant excipients to solubilize paclitaxel have met with limited success in the past due to the tendency for these excipients to compromise the physical integrity and mechanical strength of conventional compressed tablets. The major obstacles for successful therapy with paclitaxel are the drug availability and its delivery. Hence, effective therapy using paclitaxel is dependent on the development of drug delivery systems. Since paclitaxel has poor aqueous solubility, it was essential to develop an improved delivery system, which is obvious from the problems seen in present-day therapy. Therefore, the current approach is mainly focused on developing SEDDS/SMEDDS formulations by LFCS that are able to keep the drug in solution at least considerable period of time before absorption.
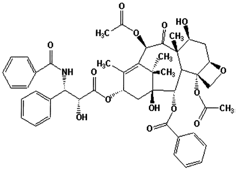
Figure 1.- Chemical structure of paclitaxel (5, 20-Epoxy-1, 2, 4, 7, 13-hexahydroxytax-11-en-9-one4,10-diacetate2-benzoate13-ester with (2R,3S)-N-benzoyl-3-phenyllisoserine).
Paclitaxel is a diterpenoid pseudoalkaloid (Figure 1), selected as a model drug candidate (BCS IV) in the current studies. Paclitaxel is a cytotoxic compound, which continues to demonstrate impressive clinical activity against many common types of solid malignancies including ovarian, breast and non-small cell lung carcinomas. Clinically, paclitaxel (6 mg/mL) is administered by intravenous (IV) infusion to patients as a clear to colorless [cremophor EL (polyoxyethylated castor oil): ethanol, 1:1 v/v] formulation in 5 mL vials. Paclitaxel is administered IV because of its low aqueous solubility (5 ug/mL) and limited bioavailability (<2%) when administered orally (19). The reasons of this poor oral bioavailability include: (i) instability in the gastrointestinal fluids, (ii) limited aqueous solubility and dissolution, (iii) affinity for intestinal and liver cytochrome P450 metabolic enzymes (CYP450), and (iv) the multidrug efflux pump, p-glycoprotein (pgp), which serves to protect the body from xenotoxins (20). SEDDS/SMEDDS, which produce micro- and or nano-emulsions, could have good potential to overcome many of these limitations. Firstly, a combination of surfactants with oils offers an advantage over a micellar or cosolvent system in terms of drug solubilisation capacities for lipophilic compounds because of the extra locus for solubilisation provided by the oil phase (4). The components of nano-emulsion (SEDDS/SMEDDS) are known also to inhibit both the Pgp and the hepatic metabolism.
2. MATERIAL AND METHODS
2.1. Chemicals
Paclitaxel was obtained from David Bull Laboratories, Victoria, Australia. Capmul was obtained from Abitec Corp., Janesville, USA. Labrasol, transcutol, capryol 90 and lauroglycol were purchased from Gattefosse, France. Hydrocortisone acetate, ethyl oleate, linoleic acid and triolein were obtained from Fluka AG, Buchs, Switzerland. Oleic acid and castor oil were obtained from LOBA Chemie, PVT. LTD, Mumbai, India. Acetonitrile was AnalaR® (Merck Pty. Ltd. Victoria) with 99.8% purity. Miglyol 812 (M812, medium chain triglyceride, C8-C10), Imwitor 988 (I988, medium chain mono- and diglycerides), Imwitor 308 (I308, 98% monocaprylate) and propylene glycol (PG, 98% pure) were supplied by Sasol Germany GmbH, Werk Witten, Germany. The non-ionic surfactants used were polyoxyethelene-(20)-sorbitan monooleate (Tween 80, HLB-15) and polyoxyethelene-(20)-sorbitan trioleate (Tween 85, HLB-11), supplied by Sigma Aldrich Pty. Ltd., Castle Hill, NSW, Australia. Another non-ionic surfactant POE (6) sorbitan monooleate (TV106, HLB approx 10) was obtained from Nikko chemicals co. ltd., Tokyo, Japan. All excipients were used without further purification. Water used in this study was obtained from a Milli-Q water purification system (Sartorius, Geottingen, Germany). All other chemicals and solvents were of analytical purity or high performance liquid chromatography (HPLC) grade, respectively..
2.2. Formulation design
The excipients used in this research and the way in which they were blended together to represent various types within LFCS shown in Table 1. Combinations of Miglyol 812 (M812, medium chain triglycerides) with Imwitor 988 (I988, medium chain mixed mono & diglycerides) and Tween 85 (T85) containing between 15% and 90% T85 & TV106 produced Type II systems, i.e. self-emulsifying systems (SEDDS) that have no water-soluble components. However, using I988 in the Type II systems changed the polarity of the oil component, and improved the performance in terms of dispersibility.
Table 1.- Materials used in anhydrous mixtures classed as Type II, III and IV lipid formulations. Key: M812 – Miglyol 812, I988 – Imwitor 988, I308 – Imwitor 308, T85 – Tween 85, POE-25-sorbitan trioleate, T80 – Tween 80, POE-25-sorbitan monooleate, TV106 = POE (6) sorbitan monooleate, PG – propylene glycol.
LFCS Type |
Oil (%w/w) |
Surfactant (%w/w) |
Cosolvent (%w/w) |
||||
M812 |
I988 |
I308 |
T85 |
TV106 |
T80 |
PG |
|
IIA |
35 |
15 |
50 |
||||
IIB |
35 |
15 |
50 |
||||
IIIA |
35 |
15 |
50 |
||||
IIIB |
50 |
50 |
|||||
IVA |
25 |
50 |
25 |
||||
IVB |
100 |
||||||
The replacement of T85 with Tween 80 (T80, a water-soluble surfactant) produced Type IIIA formulations, capable of producing very fine dispersions (<100 nm, optically clear). Replacement of the oil mixture with Imwitor 308 (I308, predominantly glyceryl mono caprylate) in combination with T80 produced Type IIIB self-microemulsifying drug delivery systems (SMEDDS). Addition of propylene glycol could be added in place of some of the I308 to make the Type IVA formulation more hydrophilic. Type IVB formulations were simply lipid free as used T80 alone. The whole range of lipid systems from the most lipophilic Type II, through Type IIIA, Type IIIB to Type IV, were studied using just seven components; M812, I988, I308, T85, T80, TV106 and PG by changing just one excipient at a time.
2.3. Equilibrium phase studies
The equilibrium phase studies were conducted partly to select efficient self-emulsifying formulations for LFCS Type IIIB and IV systems. For Type II and IIIA efficient self-emulsifying formulations were selected from the previously studied phase diagrams (21). To construct ternary and pseudo-ternary phase diagrams, initially the primary blends were prepared by weighing (% w/w due to viscosity of the materials) different proportions of oils, surfactants and/or cosolvents. When oils were blended to modify the polarity of the oil phase, for practical reasons the oil mixture ratio was kept constant so that the oily components could be plotted on one axis. This allowed anhydrous mixtures containing three or four excipients to be plotted on ternary diagrams, for simplicity and to allow direct comparison with two-component anhydrous mixtures. The blends were thoroughly mixed with a vortex mixer, with heating if necessary, to ensure homogeneity. The blends were subsequently titrated with water at different percentages (10%, 20% up to 90%). Samples were stored in glass tubes (12 × 100 mm) with watertight screw cap closures for further examination. Samples were examined at room temperature (RT, 20°C), and then equilibrated in water bath at 37°C for 48 hours to provide sufficient time for all the temperature-related changes to take place (21, 22).
Each mixture was visually observed and classified as single phase or multiphasic (turbid) mixtures. Liquid crystalline phases were identified, using a polarizing plate fitted with cross-polarizing filter. Liquid crystalline phases were further identified as hexagonal or lamellar, whenever possible, based on the birefringence patterns observed under crossed polarized light of an optical microscope (Carl Zeiss, Axiolab, Jena, Germany) employing a magnification of 10-40X (14, 22).
2.4. Visual assessment and particle size distribution of the formulation
A visual test to assess the self-emulsification properties reported earlier (23, 24) was modified and adopted in the present study. The visual test is mainly conducted to evaluate thoroughly the formulations for excipients spontaneity, homogeneity, dispersibility and appearance after aqueous dilution. 100mg formulation was introduced into 100 ml (1 in 100 dilution factor) of water in a glass beaker at room temperature, and the contents were agitated gently with a glass rod. The tendency to emulsify spontaneously and also the progress of emulsion droplets were observed against time.
Spontaneity was judged as ‘efficient’ when the droplet easily spreaded in water, to form emulsion, within 1 min. Homogeneity was termed as ‘good’ when the excipients were miscible in prolonged with no phase separation. Dispersibility was termed as ‘good’ if the formulation particles were able to completely disperse in water without any suspended particles.
For further characterisation, the appearance of the formulations was also judged as milky, hazy or transparent according to the degree of clarity after aqueous dilution.
In this study, the Zetasizer3000 (Malvern Instruments Limited, UK) was used in standard autosizer mode to evaluate the particle size distribution of the emulsions after dispersion in water. The representative self-emulsifying formulations were diluted in a ratio of 1: 1000v/v (SEDDS: distilled water) and mixed for 1 min before testing (24, 25). This analysis was performed on sample volumes of 1ml using glass cuvettes. All measurements were performed at room temperature in triplicate, with 10-min runs, using a 400 mm aperture. Values were mean of three separate determinations for each formulation. Each determination consisted of three experiments and each experiment was analyzed ten times. Results were expressed as the Z-average mean, which is the harmonic intensity, averaged particle diameter.
2.5. Equilibrium solubility studies
The solubility of paclitaxel within the LFCS representative formulations was determined using the shake flask method (21, 26). Samples were prepared by adding an excess amount of drug (approximately 200 mg) to 1g of the formulation followed by subsequent shaking with the vortex mixer to ensure adequate mixing. After a 7-day period of equilibration, the samples were removed for solubility determinations. The samples were centrifuged using 1.5 ml eppendorf tubes (at 13000 rpm for 15 min) to separate excess solid drug from dissolved drug. Then, an aliquot of the supernatant was taken by weight for dilution in acetonitrile and assayed by HPLC. Three replicate samples were considered for analysis of each formulation.
2.6. Dynamic dispersion studies
All the representative LFCS formulations investigated in equilibrium solubility studies were subject to corresponding dynamic dispersion studies, the aim being to find out if the drug was precipitated during dispersion, and if does, then monitoring the rate and proportion. These studies were conducted dissolving paclitaxel separately in each formulation at a concentration representing 80% of its equilibrium solubility in the relevant anhydrous formulation. Dynamic dispersion experiments were performed by diluting 1g of each formulation in 100 ml water. The dispersion was occasionally agitated by inverting the container and kept in a dry heat incubator at 37°C for 24 hours. During this 24 hours period the dispersions were assayed periodically by HPLC to examine precipitation. For assay, 1 ml dispersed sample from each tube was withdrawn after 0, 0.5, 1, 2, 4, 8, 16, and 24 hours, and centrifuged for 15 minutes at 1600 g. A 100 μL aliquot of the resulting clear supernatant was taken for dilution with appropriate amount of acetonitrile prior to assay by HPLC. All experiments were carried out in triplicates.
2.6. HPLC assay
The study employed a high pressure liquid chromatograph (WatersTM 1515 isocratic controller, Waters, USA) equipped with a Waters 2487 Dual λ Absorbance detector and an automatic sampling system (WatersTM 717). The mobile phase consisted of acetonitrile and 20 mM phosphate buffer (pH 5) (50:50%v/v), and the flow rate was 1 mL/min. Separation was achieved using a 150 mm x 4.6 mm (i.d.) C18, μ BondapakTM, Waters, reversed phase column with an average particle size of 10 μm, and the column was kept at ambient temperature. The column effluent was monitored at 229 nm and the chromatographic data analysis was performed with the EmpowerTM Program (Waters, USA).
3. RESULTS and discussions
Equilibrium phase studies
Within the scope of the current studies, the phase diagrams of Type IIIB and IVA systems, which have been presented in Figures 2&3 share a common phase transitions. Ternary diagrams can be used to identify which phase behaviour correlates with good self-emulsification, and to some extent give an understanding of the mechanisms of self-emulsification. For the purpose of this study it was desirable to select self-emulsifying systems that were able to solubilize large volumes of water during dispersion. This way the effect of formulation dispersion in water could be studied, as often as possible, without the complications introduced by formation of multiphasic mixtures.
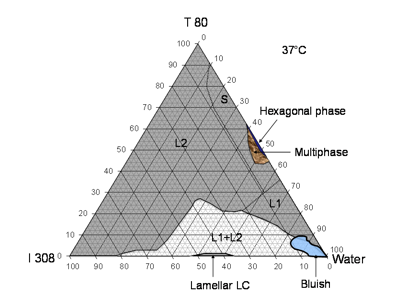
Figure 2.- Phase behavior of I308/T80/water system at 37ºC (LFCS-Type IIIB systems). The three sides represent the corresponding binary compositions. The shaded L2 area represents isotropic oil continuous phase, S-dense transparent surfactant continuous phase, L1- water continuous phase, (L1+L2) - two phases emulsion and the bluish phase which is thought to be L1+L2 O/W microemulsion that formed in the system at 90-99% dilution. Lamellar and hexagonal phase were observed under crossed polarized light of an optical microscope (Carl Zeiss, Axiolab).
The results from the phase diagram of I308/T80/water systems show that I308 (medium chain monoglycerides) with hydrophilic surfactant T80 produced a dramatic change in the extent of water absorption by the L2 phase (Fig 2). I308 with T80 at 50% w/w concentration was able to solubilized more than 70% water, which even further increased with higher surfactant concentrations. I308 itself was able to absorb about 18% water though it had limited solubility in water. This observation indicates that I308 is a rather unique excipient which may be very useful for lipid formulations. In addition to the L2 region there were other regions of the phase diagram which appeared to be optically clear. These were sub-divided, according to our current understanding of these systems, into L2, S and L1 phases. The sub-division was based largely on differences in viscosity (Fig 2, caption). A bluish transparent phase was observed in the L2 phase at very high water contents in regions that were thought to be bicontinuous in nature (Fig 2).
The internal structure of the non-birefringent transparent mixtures labelled L2 and L1 was expected to be diverse. This apparently continuous region could have included isotropic oil-continuous solutions, isotropic water-continuous solutions, O/W microemulsions, W/O microemulsions and possibly bicontinuous phases. Close to the T80/water axis was a highly viscous region which was not LC which we referred to as L1. Addition of oil caused a significant reduction of viscosity at a particular concentration, which was interpreted as a change to the less viscous L2 phase, assumed to be oil-continuous. Many of these systems were rich in surfactant, and could be referred to as ‘surfactant phase’, that is a surfactant-continuous liquid phase with large masses of co-solubilized water and oil. The conductivity studies referred to previously published paper (21) confirmed that the L2 phase contained available water above 50% water content, but it was not possible to be sure about the internal structure of these systems with the available data. The I308/T80 system was well suited to a study of its potential to solubilize drugs during the dilution of anhydrous mixtures.
The addition of the cosolvent PG in I308/T80 system was investigated to produce a definitive Type IVA system which made the system even more hydrophilic. There was an additional benefit of including PG at the expense of I308, which could be useful to reduce wax formation due to the tendency of I308 to crystallize at ambient temperatures. PG was mixed at a fixed ratio with I308 (50:50 %w/w) and blended further with other components in the ternary systems (Fig 3). The large continuous region labeled L2 remained transparent until 95% water was solubilized, remarkably covering the majority of the phase diagram. The cosolvent enhanced the solubilization of water so that the I308/PG (1/1) blend could absorb up to 40%w/w water, though the I308 was still very poorly soluble in water.
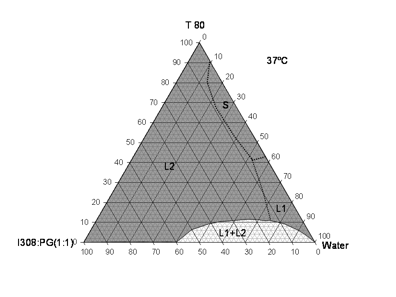
Figure 3.- Phase diagram of the I308: PG (1:1)/T80/water systems at 37ºC displaying a large miscible isotropic regions for formulations of various compositions (LFCS-Type IVA systems).
Equilibrium solubility of Paclitaxel in lipid formulation
One potential strategy to improve the bioavailability associated with such compounds is to make use of lipid blends, in which the compounds can be solubilized prior to oral administration (28). The equilibrium solubility of paclitaxel in LFCS formulation is shown in Table 2.
Paclitaxel had substantially higher solubility in the T80 (hydrophilic surfactant) alone or with the combination of polar oils (e.g., I308/T80 system). In case of Type IIA and IIIA systems, blending M812 & I988 in a fixed ratio of 7:3 with T85 & T80 showed significant different of the paclitaxel solubility. Substitution of T80 in Type IIIA formulation raised solubility from 32.25 to 44.28mg/g. Formulation of Type IIIA systems by substitution of T85 with T80 was not associated with a loss of solvent capacity. The Type IIIB (I308/T80) systems did have lower solvent capacity, though it had still higher solubility of approximately 54.11mg/g. Judging from the solvent capacity of T80 (64.80mg/g), the solvent capacity of I308 must be similar to T80, though this was not determined due to the semi-solid nature of I308 at ambient temperatures.
The solvent capacity of formulations containing PG was largely compromised, and this reflected the poor solvent capacity and solubility with PG for the model drug.
Table 2.- Solubility of paclitaxel in the representative anhydrous and diluted formulations of LFCS conducted by HPLC at 37ºC temperature. Mean ±SD, n=3. *Paclitaxel solubility in water is 2.47±1.67 (µg/ml).
Type (LFCS) |
Formulation (%W/W) |
Anhydrous Solubility (mg/g) |
Solubility (µg/ml) in % water |
||
90% |
99% |
||||
IIA |
M812:I988(7:3)/T85[1/1] |
32.25±0.58 |
133.83±11.00 |
20.86±0.50 |
|
IIB |
M812:I988(7:3)/TV106[1/1] |
30.33±1.28 |
121.35±9.10 |
14.85±4.36 |
|
IIIA |
M812:I988(7:3)/T80[1/1] |
44.38±0.61 |
124.36±2.63 |
27.92±5.77 |
|
IIIB |
I308/T80[1/1] |
54.11±1.28 |
109.62±8.77 |
29.86±19.15 |
|
IVA |
PG:I308 (1:1)/T80 [1/1] |
31.80±1.31 |
94.51±3.97 |
23.09±5.60 |
|
IVB |
T80 |
64.80±1.32 |
257.18±2.16 |
32.66±5.70 |
|
The solubility studies in 90% & 99% diluted formulation were also attempted for all LFCS representative formulation systems (Table 2). The general hypothesis behind these studies was that the higher the aqueous solubility, the greater the mass of drug that will be dissolved in the gastrointestinal fluid, and hence be readily available for absorption. Although it should be noted that digestion could change the solvent capacity of the aqueous contents of the intestinal lumen. The experimental results from the aqueous solubility of Type II-IV systems suggested that the solubility of paclitaxel in the aqueous media follows an approximately linear relationship, which decreased with the volume fraction of water (Table 2). This also suggests that the aqueous phase was a poor solvent for paclitaxel.
For the ideal interpretation of solubility data it is helpful to refer to the phase studies, particularly at 90-100% water. Solubility of the drug is influenced by the changes in phase behaviour due to the dilution. At most dilutions (i.e. over most of the phase diagram) the drug would be distributed within multiphasic mixtures, typically in oil-in-water emulsions. For highly lipophilic compounds the drug is much more soluble in oil than water, so the equilibrium solubility depends primarily on the volume fraction of oil. In the case of the M812:I988(7:3)/T85 system at weight ratio of 50/50 % w/w, a mass of 32.25mg of paclitaxel can be solubilized within 1 g of the formulation (Table 1). A 99% aqueous dilution of the same formulation was able to solubilize only 0.021 mg drug, implying that 100ml of the 1 in 100 dilution should be able to solubilize 2.1mg drug.
Mass of drug remaining in solution at equilibrium after aqueous dilution
The data obtained on equilibrium solubility of paclitaxel allowed calculation of the total mass of drug which could be dissolved at equilibrium after formulations were diluted. This calculation was useful to anticipate potential cases of precipitation and was later compared with real-time studies of precipitation (Fig 4). Figure 4 shows that if a saturated solution of paclitaxel in Type II to IV systems is diluted 1:1, through to 1:99 with water, the formulation is not able to keep the majority of the drug in a solubilized state in the diluted formulation. Thus, it can be concluded that these types of formulations are not likely to retain a good proportion of their solvent capacity for paclitaxel after dispersion.
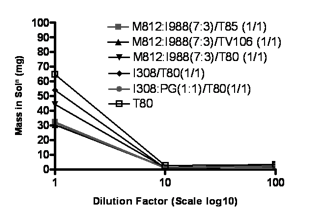
Figure 4.- Mass (mg) of paclitaxel remaining in solution at equilibrium after aqueous dilution of 1g formulation-Type II, III & IV systems. Data are presented as mean only (n=3), (SD=<2%).
Self-emulsification assessment and particle size distribution
The results of the self-emulsification assessment illustrate that the glycerides composition in lipid excipients could generate remarkable effect on the mean droplet size of the diluted self-emulsifying formulations (Table 3). The particle size measurement was important in the study to compare the effectiveness between the LFCS formulations. The mixed glycerides used in Type II and IIIA formulations showed higher mean droplet size (402nm and 288.3 nm) compare to Type IIIB, IVA & IVB formulations (140.3, 38.15, and 17.2 respectively) (Table 4). The lower particle size was produced due to the enhanced dispersion and water penetration into the formulation in case of using monoglycerides (I308). T80 (Type IVB systems) produced extremely low particle size of 17.2 nm as well as isotropic and transparent appearance upon aqueous dilution (Table 3). Accordingly, Type IIIB and IV formulations can be categorized as SMEDDS due to its ultra fine dispersion in aqueous media (28). These results indicate that the formulations containing polar oils (I308, monoglycerides) and water-soluble surfactant significantly influence the self-emulsifying efficiency and in turn the mean droplet size, which was resulted after aqueous dilution of self-emulsifying formulations (29). The mean droplet size showed significant decrease upon increasing hydrophilic materials.
Table 3.- Visual assessment and particle size distribution (determined using the Malvern Zetasizer) of dispersions formed by different formulation systems under conditions of self-emulsification.
Formulation (%w/w) |
Type |
Spontaneity |
Homogeneity |
Dispersibility |
Appearance |
Particle size (nm) |
M812:I988(7:3)/T85[1/1] |
IIA |
efficient |
√ |
~5 sec |
Milky |
402.3±16.5 |
M812:I988(7:3)/TV106[1/1] |
IIB |
efficient |
√ |
~5 sec |
Milky |
348.5±40.4 |
M812:I988(7:3)/T80[1/1] |
IIIA |
efficient |
√ |
~5 sec |
Turbid |
288.3±6.5 |
I308/T80[1/1] |
IIIB |
efficient |
√ |
< 1 min |
Hazy |
140.3±1.6 |
PG:I308 (1:1)/T80 (1/1) |
IVA |
efficient |
√ |
< 1 min |
Hazy |
38.15±3.7 |
T80 |
IVB |
efficient |
√ |
> 1 min |
Transparent |
17.2±2.5 |
Appearance of the formulation dispersion
The physical appearance after dispersion in aqueous media was investigated for selected formulations of LFCS Types II, IIIA, IIIB and IV. Initially dispersions were assessed visually and then the solubilization of paclitaxel in the dispersed system was determined over time to allow calculation of the extent of drug precipitation due to loss of solvent capacity. The Type II systems were composed of water-insoluble materials which formed a self-emulsified dispersion in aqueous media. Typically these formulations produced milky emulsions spontaneously in presence of dissolved paclitaxel (80% of the equilibrium solubility). No obvious signs of precipitation were seen by visual observation of the solution within 4 hours (Figure 5).
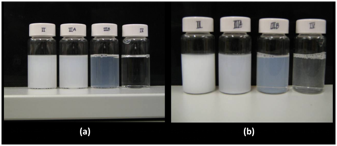
Figure 5.- Typical physical appearance of dispersed formulations- Type II, IIIA, IIIB and IV formulations immediately after dispersion. (a) aqueous dispersions of the formulations without any drug present and (b) aqueous dispersions of the formulations with paclitaxel dissolved at 80% saturated solubility. The formulation used in the experiment were M812:I988 (7:3)/T85 [1/1], M812:I988 (7:3)/T80 [1/1], I308/T80 (1/1), and T80 representing Type IIA, IIIA, IIIB and IVB systems.
When the water-soluble surfactant T80 was used in place of T85 to produce a Type IIIA formulation, the resultant dispersions were turbid. Type IIIA systems displayed crystallization of paclitaxel within the first hour. In contrast the Type IIIB formulation I308/T80 (1/1), produced a fine emulsion. Precipitation was observed by visual inspection within an hour from the initial dispersion (Fig 5). The T80 system (Type IVB) which did not contain any lipids generally formed a transparent solution of micelles on aqueous dispersion. Precipitation of the paclitaxel took place rapidly, and was visible immediately after aqueous dispersion (Figure 5).
Dynamic dispersion studies with paclitaxel
The representative LFCS formulations were studied in terms of their aqueous dispersion to evaluate how much drug stays in solution. The graph presented in Figure 6 indicates some differences in precipitation of paclitaxel from various types of lipid formulations. The aqueous dispersions of typical Type II systems [M812:I988 (7:3)/T85 (1/1) formulations] maintained approximately 58% drug in solution over the first 4 hours period. This Type IIA formulation would be expected to maintain paclitaxel in solution for long enough at least until the formulations are exposed to the digestive systems in the small intestine. Although this type of formulation has been known for many years there are no examples of marketed products which are based on this formulation strategy. In contrast, formulations with higher content of hydrophilic materials (Type IIB, IIIA &IIIB and IVA & IVB) resulted in extensive precipitation. These systems lost a significant proportion of drug to precipitation over the same period of time. The Type IIIA formulation [M812:I988 (7:3)/T80 (1/1)] was able to maintain approximately 20% drug in solution. Formulations of Type IIIA are used in pharmaceutical products, the most obvious example being the cyclosporine A product, Sandimmune Neoral. Type IIIB formulations, which (after dispersion) supported approximately 98% drug at equilibrium, resulted in precipitation of the most of the drug within the first hour. Figure 6 shows that, depending on the formulation, only 9.40% paclitaxel remained in solution 4 hours after dispersion, although the Type IIIB systems were not yet at equilibrium. The Type III formulations had the lowest concentrations of paclitaxel in the dispersion medium. Furthermore, in case of Type IV systems, more than 85% of the initial dose of drug was precipitated within one hours (Fig 6), for both T80 alone and I308: PG (1:1)/T80 (1/1) formulations. PG was added to T80 to improve the rate of dispersion, which was slow for T80 alone. The inclusion of PG lowered the total solvent capacity for paclitaxel but did not appear to make a marked difference to precipitation rate. Overall the results indicate that the lipid systems were supersaturated with respect to the paclitaxel after dilution. The rate of precipitation was highly dependent on formulation and was comparatively faster for the systems which had a higher degree of supersaturation after dilution.
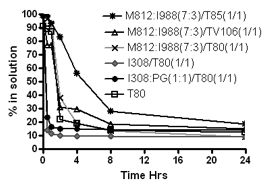
Figure 6.- % of the original dose of paclitaxel remaining in solution after 1:100 dilution in the dissolution medium (paclitaxel was originally dissolved at 80% of the equilibrium solubility in the anhydrous mixture). 1g formulation was diluted with 100 ml water and then analysed by HPLC to examine the precipitation. Data are presented as mean ± SD (n=3).
Mass of drug remaining in solution over 24 hours period after aqueous dispersion
Compositions of the Type II, III and IV formulations and the total mass of paclitaxel remaining in solution after dispersion are depicted in the Table 4. Determination of drug concentrations in the test media after dilution of the representative formulations was analytically challenging because of the non-sink conditions, which allowed the drug to exist as free molecules in solution, solubilized molecules partitioned into microemulsions, or precipitated solid particles (30). For some of the formulations the distribution of paclitaxel among these states was dynamic and changed rapidly over time. However the data in Table 4 shows that Type IIA [M812:I988 (7:3)/T85 (1/1)] formulation was able to maintain the majority of the dose in a solubilized state after dispersion within 2 hours. On the other hand, the I308/T80 (1/1) formulation (Type IIIB) was developed cloudiness within 15 minutes and a visible white crystalline precipitation was observed (Fig 2). The apparent drug concentrations in the solution were 42.5mg after 0 hours, which gradually decreased to 6.2 mg after 30 minutes and 4.9mg after 1 hour dispersion, suggest a rapid precipitation from the initial drug loading of 43.29 mg. Pure T80 was investigated as a micellar Type IVB ‘formulation’, which solubilized large amount of paclitaxel (64.80mg/g) caused precipitation sharply after 1 hour dilution with water. The dispersion tests indicated that Type IIA system was promising in relation to the low levels of paclitaxel precipitation in the first 4 hours after dispersion. On the other hand, all other LFCS Type formulations supported only 10-30% paclitaxel for 4 hours.
In the current studies, the experiments were conducted to determine the maximum equilibrium solubility of paclitaxel in anhydrous formulations and at 99% dilution. These data were compared with the results of the dynamic precipitation tests in which paclitaxel was included at 80% of its solubility in the anhydrous formulation.
Comparison of the extent of drug solubilization: anhydrous system, aqueous dilution and after 30mins dispersion
Table 5 compares the extent of solubilization by the representative formulations of LFCS. When 1g formulation of the Type IIA [M812:I988 (7:3)/T85 (1/1)] system contained 25.80mg paclitaxel was dispersed in 100 ml water, the drug remaining in solution after 30 minutes was approximately 99.14%. On the other hand, from the equilibrium solubility studies, it can be seen that only 8.09% drug can be solubilised at 1 in 100 dilutions of the same formulation. This significant difference in the value could be the loss of solvent capacity of the formulation for paclitaxel.
Table 4.- Mass of drug dissolved in each formulation at 80% saturated solubility and the mass remaining in solution as a function of time after dispersion. Mass of paclitaxel remaining in solution was determined after 0, ½, 1, 2, 4 and 24 hours by HPLC. There was a delay of 5mins before assaying the first sample (denoted as 0 Hr).
Type |
Formulation (%W/W) |
Mass in anhydrous at 80% solubility (mg/g) |
Mass (mg) in solution after 1 in 100ml dispersion |
|||||
0 Hr |
½ Hr |
1 Hr |
2 Hrs |
4 Hrs |
24 Hrs |
|||
IIA |
M812:I988(7:3)/T85 [1/1] |
25.80 |
25.6±0.2 |
25.5±0.4 |
24.1±0.1 |
21.4±0.5 |
14.4±0.6 |
4.8±0.1 |
IIB |
M812:I988(7:3)/TV106[1/1] |
24.26 |
24.3±0.6 |
18.9±0.1 |
18.8±0.4 |
7.6±0.1 |
7.2±0.2 |
3.7±0.1 |
IIIA |
M812:I988(7:3)/T80 [1/1] |
35.50 |
35.0±0.4 |
34.3±0.2 |
32.9±0.7 |
13.6±0.3 |
6.7±0.4 |
3.2±0.1 |
IIIB |
I308/T80[1/1] |
43.29 |
42.5±0.9 |
6.2±0.1 |
4.9±0.2 |
4.4±0.2 |
4.1±0.3 |
3.9±0.1 |
IVA |
PG:I308 (1:1)/T80 [1/1] |
25.44 |
25.2±0.1 |
5.9±0.4 |
4.2±0.3 |
3.8±0.2 |
3.8±0.1 |
3.7±0.1 |
IVB |
T80 |
51.84 |
47.3±0.9 |
46.2±0.8 |
45.0±0.3 |
11.4±0.1 |
9.8±0.7 |
6.5±0.1 |
Figure 7 clearly shows what the maximum equilibrium solubility, one can predict from the aqueous solution. The Figure indicates that at equilibrium, approximately 6.12% drug should remained in solution if the M812:I988 (7:3)/T80 (1/1) formulation (Type IIIA) is diluted with 99% water. In the equivalent dynamic dispersion test, more than 96% drug remained in solution after 30mins. The Type IIIB, I308/T80 (1/1) formulation solubilized 6.9% drug at equilibrium but was able to maintain only 14.31% in solution after 30mins. Similarly, Type IV systems also solubilised only 6-10% drugs at equilibrium.
The studies overall demonstrated that Type IIA formulations at 37°C resulted in prolonged solubilization of paclitaxel in the dispersion media over a 4 hour period (Fig 7). This formulation would be expected to maintain majority of paclitaxel in solution at least until the formulations are exposed to the digestive systems in the small intestine. In contrast Type IIIA, IIIB and Type IVA& IVB formulations, which contained a higher proportion of water-miscible excipients, typically lost solvent capacity quickly on dispersion. The distinction between Type IIIA and Type IIIB formulations used in this study was the polarity of the oily components. The Type IIIA formulation included a blend of medium chain TG, DG and MG making up 50%w/w of the excipient content, whereas the Type IIIB formulation contained 50%w/w medium chain MG. The difference observed in the solubilization after dispersion indicates that the TG and DG components played a significant role in maintaining the drug in solution. Although Paclitaxel has a higher solubility in Type IV systems, medium chain TG with medium chain DG or MG in presence of T80 in the Type IIIA and IIIB anhydrous formulations were not able to keep much drug in solution (Fig 6). It is worth mentioning that the representative diluted formulations (99% water) were not able to solubilize the paclitaxel which were expected from their anhydrous solubility studies.
Table 5.- Effect of 99% aqueous dilution and dynamic dispersion on the solubilization profiles for paclitaxel. Lipid formulations representing Type II, III and IV systems, that contained 80% paclitaxel of the equilibrium solubility in the anhydrous formulation, were allowed to disperse (1g in 100ml water at 37º C for ½ an hour) and analysed by HPLC to monitor drug precipitation. The extent of solubilization was compared with solubility data obtained from 99% diluted formulations.
Type |
Formulation (%W/W) |
Equilibrium solubility in anhydrous formulation (mg/g) |
1:100 aqueous dilution |
Mass in anhydrous at 80% solubility (mg/g) |
|
%paclitaxel at equilibri. solubility |
%paclitaxel after ½ hr dispersion |
||||
IIA |
M812/I988(7/3)/T85[1/1] |
32.25±0.58 |
8.09 |
99.14 |
25.80 |
IIB |
M812/I988(7/3)/TV106[1/1] |
30.33±1.28 |
6.12 |
77.27 |
24.26 |
IIIA |
M812/I988(7/3)/T80[1/1] |
44.38±0.61 |
7.86 |
96.57 |
35.5 |
IIIB |
I308/T80[1/1] |
54.11±1.28 |
6.90 |
14.31 |
43.29 |
IVA |
PG:I308 (1/1)/T80 (1/1) |
31.80±1.31 |
9.08 |
23.35 |
25.44 |
IVB |
T80 |
64.80±1.32 |
6.30 |
89.15 |
51.84 |

Figure 7.- The graph shows the overall performance of the LFCS formulation for paclitaxel. Amount of paclitaxel at equilibrium in the anhydrous formulation, mass calculated from 99% diluted formulation and after 4 hours dispersion in the dissolution medium. Formulation studied, M812:I988 (7:3)/T85 (1/1) for Type II, M812:I988 (7:3)/T80 (1/1) for Type IIIA, I308/T80 (1/1) for Type IIIB and I308: PG (1:1)/T 80 (1/1) for Type IV systems.
The data imply that the morphological form of the emulsions or microemulsions/ nanoemulsions formed by dispersion of the Type IIIA and IIIB system must have been considerably different, and this implication is worthy of further investigation. Furthermore the poor solubilization capacity of the dispersed Type IIIB formulation is evidence that poor performance can result from changes in the polarity of the oil components alone. The previous studies have indicated that inclusion of cosolvents in Type III formulations at the expense of oils often results in precipitation of drug on dispersion (11). This effect becomes more pronounced in case of paclitaxel as the proportion of cosolvent in the formulation is increased. The typical cosolvents such as PG, ethanol, and PEG suffer from lack of solubilizing power when they are diluted. The utility of Type IV systems comprising drug in a surfactant only solution are typically limited by slow dispersion of the formulation. This may be overcome by the inclusion of a cosolvent but with reduction in solvent capacity after dilution. The studies here show that poor performance of hydrophilic Type IIIB formulations can occur in the absence of cosolvents, when polar oils such as medium chain MG are used. The data emphasize the need for more in vitro evaluation of alternative types of formulations using a dispersion/precipitation test, allowing formulations to be described using performance-related criteria. In addition, in-vitro digestion studies also required to be performed in the physiological media in the near future
4. CONCLUSION
Selecting the most suitable lipid-based formulation system for a particular drug is challenging and poorly understood. A better understanding of the fate of lipid formulations after dispersion and digestion is required, for a range of different drugs. The data presented here for paclitaxel formulations suggest that for lipophilic drugs the use of comparatively lipophilic formulations, i.e. Type II and Type IIIA, is recommended to maximise the chance of maintaining the drug in solution after dispersion of the formulation in the stomach. This strategy would ensure that the drug is emptied into the intestine in solubilized form prior to digestion. Supersaturation was a common feature of all formulations tested, however, the kinetics of precipitation varied with faster precipitation when the degree of supersaturation was high, as for Type IIIB and Type IV formulations. In these cases, a substantial proportion of the dose could be lost to precipitation during the first 1-4h, indicating that crystallisation of the drug in the stomach is a likely prospect. Overall the study suggests that Type III or Type IV formulations may be unsuitable due to substantial loss of solvent capacity for paclitaxel.
5. ACKNOWLEDGEMENTS
The author would to like acknowledging the research funding from National Plan for Science, Technology and Innovation, Riyadh, KSA.
6. REFERENCES
1. Constantinides, P. P. (1995). Lipid microemulsions for improving drug dissolution and oral absorption: physical and biopharmaceutical aspects. Pharm Res, 12, 1561-72.
2. Humberstone, A. J., & Charman, W.N. (1997). Lipid-based vehicles for the oral delivery of poorly water soluble drugs. Adv. Drug. Deliv. Rev., 25, 103-128.
3. Serajuddin, A. T. M. (1999). Solid dispersion of poorly water-soluble drugs: Early promises, subsequent problems, and recent breakthroughs. Journal of Pharmaceutical Sciences, 88, 1058-1066.
4. Lawrence, M. J., & Rees, G. D. (2000). Microemulsion-based media as novel drug delivery systems. Advanced Drug Delivery Reviews, 45, 89-121.
5. O'driscoll, C. M., & Griffin, B. T. (2008). Biopharmaceutical challenges associated with drugs with low aqueous solubility-The potential impact of lipid-based formulations. Adv Drug Deliv Rev, 60, 617-624.
6. Hauss, D. J. (2007). Oral lipid-based formulations. Adv. D. Del. Reviews. 59 (7), 667-676.
7. Hashash, A., Kirkpatrick, D. L., Lazo, J. S., & Block, L. H. (2002). Solubility, ionization, and partitioning behavior of unsymmetrical disulfide compounds: alkyl 2-imidazolyl disulfides. J Pharm Sci, 91, 1686-92.
8. Ran, Y., He, Y., Yang, G., Johnson, J. L., & Yalkowsky, S. H. (2002). Estimation of aqueous solubility of organic compounds by using the general solubility equation. Chemosphere, 48, 487-509.
9. Yalkowsky, S. H. (1981). Techniques of Solubilization of Drugs. 15-81.
10. Pouton, C. W. (1997). Formulation of self-emulsifying drug delivery systems. Advanced Drug Delivery Reviews, 25, 47-58.
11. Pouton, C. W. (2000). Lipid formulations for oral administration of drugs: non-emulsifying, self emulsifying and 'self microemulsifying' drug delivery systems. Eur. J. Pharm. Sci., 11 (2), S93-S98.
12. Pouton, C. W. (2006). Formulation of poorly water-soluble drugs for oral administration: physicochemical and physiological issues and the lipid formulation classification system. Eur J Pharm Sci, 29, 278-87.
13. Shah, N. H., Carvajal, M.T., Patel, C.I., Infeld, M.H., & Malick, A.W (1994). Self-emulsifying drug delivery systems (SEDDS) with polyglycolyzed glycerides for improving in vitro dissolution and oral absorption of lipophilic drugs. International Journal of Pharmaceutics, 106, 15-23.
14. Pouton, C. W. (1985). Self-Emulsifying Drug Delivery Systems - Assessment of the Efficiency of Emulsification. International Journal of Pharmaceutics, 27, 335-348.
15. Shah, N. H., Phuapradit, W., Zhang, Y-E., Ahmed, H., & Malick, A.W. (Ed.) (2007). Lipid-based isotropic solutions: design considerations, New Jersey, USA, Informa health care.
16. Horter, D., & Dressman, J. B. (2001). Influence of physicochemical properties on dissolution of drugs in the gastrointestinal tract. Adv Drug Deliv Rev, 46, 75-87.
17. Dressman, J. B., Alsenz, J., Schamp, K., & Beltz, K. (2007). Characterizing release from lipid-based formulations, in: Hauss, D. J. (Ed), Oral lipid-based formulations: enhancing the bioavailability of poorly water soluble drugs, New York, Informa Healthcare, Inc., pp. 242-245.
18. Chono, S., Takeda, E., Seki, T., & Morimoto, K. (2008). Enhancement of the dissolution rate and gastrointestinal absorption of pranlukast as a model poorly water-soluble drug by grinding with gelatin. Int J Pharm, 347, 71-8.
19. Beijnen, J.H., Huizing, M.T., ten Bokkel Huinink, W.W., Veenhof, C.H., Vermorken, J.B., Giaccone, G., & Pinedo, H.M. (1994). Bioanalysis, pharmacokinetics, and pharmacodynamics of the novel anticancer drug paclitaxel (Taxol). Semin. Oncol., 21, 53-62.
20. Zhangand, Y., & Benet, L.Z. (2001). The gut as a barrier to drug absorption: combined role of cytochrome P450 3A and P-glycoprotein. Clin. Pharmacokinet, 40, 159-168.
21. Mohsin, K., Long, M. A., & Pouton, C. W. (2009). Design of lipid-based formulations for oral administration of poorly water-soluble drugs: Precipitation of drug after dispersion of formulations in aqueous solution. J Pharm Sci., 98 (10), 3582-95.
22. Kossena, G. A., Charman, W. N., Boyd, B. J., Dunstan, D. E., & Porter, C. J. (2004). Probing drug solubilization patterns in the gastrointestinal tract after administration of lipid-based delivery systems: a phase diagram approach. J Pharm Sci, 93, 332-48.
23. Craig, D. Q. M., Barker, S. A., Banning, D., & Booth, S. W. (1995). An Investigation into the Mechanisms of Self-Emulsification Using Particle-Size Analysis and Low-Frequency Dielectric-Spectroscopy. International Journal of Pharmaceutics, 114, 103-110.
24. Kommuru, T.R., Gurley, B., Khan, M.A., & Reddy, I.K. (2001). Self-emulsifying drug delivery systems (SEDDS) of coenzyme Q10: formulation development and bioavailability assessment. International Journal of Pharmaceutics, 212, 233-246
25. Atef, E., & Belmonte, A.A. ( 2008). Formulation and in vitro and in vivo characterization of a phenytoin self-emulsifying drug delivery system (SEDDS). Eur J Pharm Sci, 35, 257-263.
26. Baka, E., Comer, J.E.A., &Takács-Novák, K. (2008). Study of equilibrium solubility measurement by saturation shake-flask method using hydrochlorothiazide as model compound. Journal of Pharmaceutical and Biomedical Analysis, 46(2), 335-341.
27. Pouton, C. W. (1999). Key issues when formulating with lipids. B.T. Gattefosse, 92, 41-50.
28. Gursoy, R. N., & Benita, S. (2004). Self-emulsifying drug delivery systems (SEDDS) for improved oral delivery of lipophilic drugs. Biomed Pharmacother, 58, 173-82.
29. Pouton, C. W., & Porter, C. J. (2007). Formulation of lipid-based delivery systems for oral administration: Materials, methods and strategies. Adv. Drug. Deliv. Rev., 60, 625-637.
30. Gao, P., Rush, B. D., Pfund, W. P., Huang, T., Bauer, J. M., Morozowich, W., Kuo, M. S., & Hageman, M. J. (2003). Development of a supersaturable SEDDS (S-SEDDS) formulation of paclitaxel with improved oral bioavailability. J Pharm Sci, 92, 2386-98.