ARTÍCULO |
Separation between toxin-producing and non-toxic clones of Microcystis aeruginosa using lectins
Victoria López Rodas, Raquel González, Eduardo Costas*
Laboratorio de Genética. Facultad de Veterinaria. Universidad Complutense. E-28040. Madrid, Spain.
Recibido el 14 de octubre de 2011.
e-mail: ecostas@vet.ucm.es
ABSTRACT
Microcystis aeruginosa (the most widespread toxic cyanobacteria worldwide) occurs in dense blooms composed of toxin-producing and non-toxic strains. Current microscopy techniques monitoring of toxic cyanobacteria are unable to distinguish toxic and non-toxic strains. In contrast, a new assay using lectins is able to differentiate among the different M. aeruginosa strains based on microcystin production. We analyze thirty-five cultured strains of M. aeruginosa isolated from 4 different blooms in three water supply reservoirs and a lagoon as well as a lot of M. aeruginosa colonies directly collected from field samples. All non-toxic M. aeruginosa strains were positively bound with UEA-1 lectin and by several other lectins. In contrast, the most toxic strains remain unbound. This procedure also was successful in field samples. Although other techniques allow for the differentiation between toxic and non-toxic strains, none of them is as fast, simple and easy as lectin-binding pattern. |
Key words: Lectin; Microcystis aeruginosa; Toxicity.
RESUMEN
Diferenciación entre clones productores de tóxina y no tóxicos de Microcystis aeruginosa mediante el uso de lectinas
Microcystis aeuruginosa (la cianobacteria tóxica más extendida mundialmente) es la responsable de “blooms” o floraciones que están compuestos por cepas tóxicas y no tóxicas. Las técnicas de microscopia utilizadas actualmente no permiten distinguir entre las cepas tóxicas y las no tóxicas. Por el contrario, un nuevo procedimiento empleando lectinas es capaz de diferenciar entre las cepas de M. aeruginosa basándose en la producción de microcistina. Se analizaron treinta y cinco cepas aisladas de M. aeruginosa aisladas de cuatro blooms diferentes en tres depósitos de abastecimiento de agua y en una laguna, así como una gran cantidad de colonias de M. aeruginosa directamente recogidos de muestras de campo. Todas las cepas no tóxicas de M. aeruginosa fueron marcadas positivamente con la lectina UEA-1 y por varias otras lectinas. Sin embargo, las cepas más tóxicas permanecieron sin marcar. Este procedimiento también tuvo éxito en muestras de campo. Aunque existen otras técnicas que permiten la diferenciación entre cepas tóxicas y no tóxicas, ninguna es tan rápida y simple como el marcaje por lectinas. |
Palabras clave: Lectina; Microcystis aeruginosa; Toxicidad.
1. introducTIOn
Toxic cyanobacterial blooms in eutrophic lakes, rivers, and reservoirs have been reported during the last decades all over the world (1-4). These toxic blooms have caused the death of livestock and wildlife and illness and even death in humans (5, 6). For example, over 50 patients at a dialysis center in Caruaru, Brazil, died from February to September 1996 of acute liver failure. Although the cyanobacterial species responsible have not yet been identified completely, microcystins produced by cyanobacteria were detected in water from the reservoir and the dialysis center, and in serum and liver tissue of affected patients (7). Other incidents have also been reported in other countries such as China, where cyanobacterial blooms are a great health problem (8-10). Moreover, long-term exposure to low levels of microcystins in drinking water could be a risk factor for liver and colorectal cancer in Europe (11). The World Health Organization has set a provisional guideline value of 1.0 µg.liter-1 for this toxin (10). In addition, cyanobacterial blooms pose a challenge for wildlife conservation because they are caused of repeated mass mortalities of fishes and water birds in wildlife refuges (13-16).
Although more than 40 species of cyanobacteria produce of cyanotoxins, Microcystis aeruginosa (Kützing) Kützing is considered the most prevalent harmful species in freshwater ecosystem (1). In fact M. aeruginosa is the most important cause of toxic cyanobacterial blooms affecting humans and animals in inland water systems worldwide (1, 7, 17-20).
Microcystins are a group of monocyclic heptapeptide hepatotoxins produced by M. aeruginosa, which are the end products of a secondary metabolic pathway synthesized non-ribosomally by multienzymes comprising non-ribosomal peptide synthetases, polyketide synthases and tailoring enzymes (21). These peptides are inhibitors of serine-treonine protein phosphatases 1 and 2A (22-26).
The genetic basis of microcystin production is complex. It has been observed that all the blooms containing microcystin-producing strains also contain related strains that lack the ability to produce this toxin (24). In addition, usually, patches of high- and low-toxin concentration occur simultaneously in the same water body (27, 28). In short, Carrillo et al. (29) and Martín et al. (30) documented a great genetic variability in microcystin production in different M. aeruginosa strains isolated from the same waterbloom, very toxic to non-toxic strains occurring together were documented. It is thought that the difference between microcystin producing (toxic) and nonproducing (nontoxic) strains of cyanobacteria lies primarily in the presence or absence of microcystin synthetase gene cluster (31, 32). Finally, it is tested to that the production of toxin in a M. aeruginosa bloom also varies with time (24, 28).
Some studies attribute the higher or lower production of toxin to environmental factors such as nitrogen and phosphorus concentration, light intensity or temperature (24, 33). However, laboratory studies have shown that environmental factors induce changes in the concentration of toxins, but to a lesser magnitude than those observed between different strains grown under the same environmental conditions (reviewed by 20).
Combinations of experiments and statistics procedures were employed for estimating the proportion of genetic versus phenotypic variability (heritability) in microcystin net production on 18 M. aeruginosa strains. Results indicated that more than 70% of microcystin net production variability is due to genetic differences among strains (34). Consequently, genetic factors appear to be the main cause of the spatial-temporal heterogeneity observed in microcystin production.
Additionally, most of the phenotypic variability for the most important quantitative traits of M. aeruginosa (i.e. growth rate, respiration, photosynthetic efficiency, use of inorganic carbon, pigment concentration, photochemical and non photochemical quenching, morphology and others) is also due to genetic differences among strains and not to the environment (35-37).
Since asexual reproduction prevails blooms of M. aeruginosa could exist as large clonal families, and consequently clones of ancient divergence can be quite different from one another by mutations. Due to importance of genetic differences for the most significant quantitative traits of M. aeruginosa (including microcystin production) analyze and characterize the different strains forming a bloom has a significant environmental relevance.
Nowadays, differentiation of cyanobacteria species and strains are based on modern procedures of molecular genetics (38). PCR procedures focused to identification of microcystin-producing genotypes of different cyanobacteria species have been carried out successfully (39-41). However, most of water supply enterprises analyze phytoplankton composition from reservoirs through optical microscopy regulated by European legislation (Directive 2000/60/EC) (42) as a routine technique. Consequently, a search for alternative methods based on microscope procedures to differentiate between toxin-producing and non-toxic M. aeruginosa strains is vital.
Lectins are carbohydrate-binding proteins or glycoprotein of non-immune origin, which specifically conjugates with monosaccharides or simple oligosaccharides (43). Lectins are important reagents for analyzing cell surface and cell components in bacteria, yeast, protozoa and higher microorganisms (reviewed by 44, 45). They play a role in biological recognition phenomena and the interaction of lectins with the surfaces of microorganisms has been widely applied for typing bacteria and protists (reviewed by 46, 47). In a pioneer paper, Costas & López-Rodas (1994) (48) demonstrated that different species and strains of marine dinoflagellates could be identified microscopically using fluorescent lectins. This lectin-binding procedure is also able to discriminate between toxin-producing and non-toxic strains of marine dinoflagellates of genus Gymnodinium. This ability of lectins to bind non-covalently to sugars of surface cells has received early attention in phycological studies. Lectins have been used to differentiate species and strains of several microalgal species (49-51) including toxic dinoflagellates (52, 53) and domoic-acid producing diatoms (54). Lectins were also effective probes for differentiating between different species and strains of Microcystis sp (55, 56) and other toxic cyanobacteria species (57). These results indicate that lectins could be useful tools in discriminating species and strains of toxic cyanobacteria.
In this regard, Kehr et al. (2006) (58) report the discovery of a new lectin, microvirin (MVN), isolated from M. aeruginosa strain PCC7806, which is involved in cell-cell attachment of M. aeruginosa. Apparently, MVN lectin is differentially expressed in microcystin-producing wild type genotypes and mutants lacking the microcystin.
In this study, we analyze the usefulness of fluorescent-labeled lectin assays to microscopically differentiate strains of M. aeruginosa that occurs simultaneously within the same and between blooms. Three M. aeruginosa blooms in water supply reservoirs of Spain as well as one bloom, which caused mass mortality of wildlife in Doñana National Park (Spain) were analysed. The results suggest that fluorescent lectins are a rapid procedure to microscopically characterize strains and to discriminate between toxic and non-toxic strains of M. aeruginosa.
2. MATERIALS AND METHODS
2.1 Experimental organisms and growth conditions
Experiments were carried out using thirty-five strains of Microcystis aeruginosa (Kützing) Kützing from the Algal Culture collection, Genetics laboratory, Facultad de Veterinaria, Universidad Complutense de Madrid, Spain. Strains were collected from water samples of four M. aeruginosa blooms. Three blooms occurred in the water supply reservoirs of El Gergal, La Minilla and Cuerda del Pozo (Andalusia, Spain) and the other bloom occurred in Doñana National Park (Spain) causing mass mortality of wildlife (data in 16, 30, 37). These water supply reservoirs provide water to more than 1.5 millions people in Spain. Doñana National Park is classified as a Special Protection Area by the European Union under Directive 79/409, because of its ecological value and international relevance.
Isolation of cells and colonies was made using a Zeiss-Eppendorf micromanipulator-microinjector and each strain was obtained from a single vegetative cell separated from a M. aeruginosa colony. Cultures were grown axenically in tissue culture flasks (Greiner, Bio-One Inc. Longwood, NJ, USA) containing 20 ml of cyanobacterial BG-11 medium (Sigma, Aldrich Chemie, Taufkierchen, Germany), at 22ºC and 120 µmol m-2 s-1 over waveband supplied by daylight fluorescent tubes. Clones were maintained in mid-log exponential growth by serial transfers of an inoculum to fresh medium once every two weeks. Under these conditions, all the cultures grew asexually. The absence of bacteria was tested periodically by epifluorescence observation after staining with acridine orange. Only cultures lacking bacteria were employed.
2.2. Measurement of toxicity
The toxin production of the different strains was measured as previously described (29, 34). Two quantitative tests for the detection of microcystins residues in water were employed. A microcystin-specific enzyme-linked immunoabsorbent (ELISA) test was used (EnviroGard Microcystin Quantitube Test Kit; Strategic Diagnostic, Newark, N.J., USA) as well as a phosphatase-inhibition based test for the detection of microcystins (Microcystest, ZEU-Immunotech, Zaragoza, Spain), according to the manufacturer´s recommendations. The cells of each aliquot were broken by freezing, sonication, and intense agitation. The insoluble cell debris was removed by centrifugation (2500 × g, 10 min.). Six measurements of each strain were run to estimate confidence intervals. Additionally, the toxicity of the water samples from the four different blooms was also measured using the same procedure.
2.3. Lectin-binding pattern
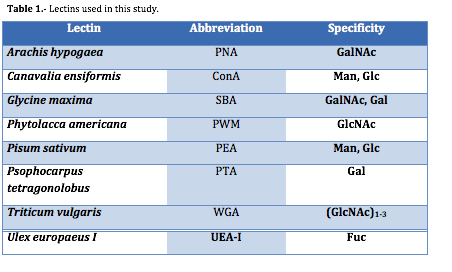
Lectin-binding was developed using different eight FITC-labelled lectins showed in Table 1 (Sigma Chemical Company, USA). Each of the 35 strains was treated with the lectin at a 0.1 µM dilution as previously described (48, 50 56). Cells were centrifugated, in order to separate the supernatant and collected the pellet (2500 x g, 20 min), rinsed with BSA to prevent nonspecific lectin binding, and aliquots of 105 ± 103 cells were incubated with each fluorescent lectin for 1 h at 20ºC. Subsequently, cells were washed three times in PBS. Additionally, water samples from the four different M. aeruginosa blooms were treated with the lectins employing the same procedure.
The washed cells were evaluated through a Zeiss Axiovert microscope with FITC filter set (450-490 nm excitation and 520-560 nm emission) for epi-fluorescence. All tests were read “blind”: the person reading the test results did not know the origin of the tested material. Three different observers read all samples. In all cases, positive (cells stained with acridine orange) and negative (cells incubated with FITC non-labelled lectins) controls were used.
Images of lecting binding were captured using a digital camera (Canon EOS 450d) connected to a microscopy and were processed using an image analysis programme.
In addition, Statically analysis were done by calculating a non linear regression analysis between toxin production (in µg microcystin LR-equivalent per cell) versus the number of lectin that positively label the strain, using the computer software package GraphPad Instat 3.0 (Graph-Pad Software Inc, USA). Differences were considered to be significant P < 0.01).
Lastly, a dendrogram was realised using a binary hierarchical cluster analysis (method average linkage using SPSS software; 0 for negative and 1 for positive lectin binding respectively).
3. RESULTS
The results confirmed that optical examination under an epi-fluorescence microscope is a rapid and precise procedure to evaluate the lectin-binding activity. The green fluorescence observed was very intense in the colonies positively labeled with lectins, both at the cell surface as well as on inter-cellular matrix. In additon, a similar staining pattern is shown by all the M. aeruginosa colonies from a same strain (as well as all the cells of the same colony).
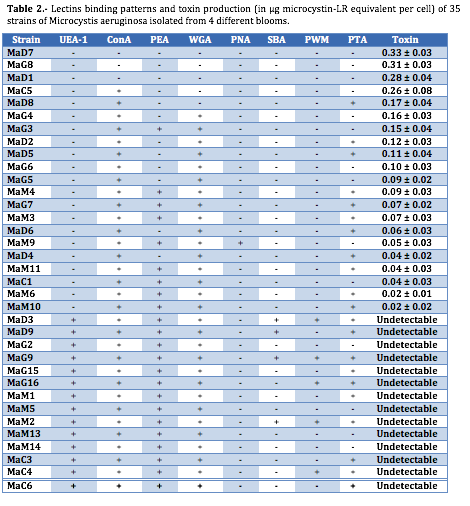
Experiments assessing presented that several lectins (Con-A, WGA) are able to bind most of M. aeruginosa strains. In contrast, other lectins (PNA, SBA) bind to only a limited number of strains. Moreover, the results also confirmed that lectin-binding pattern could allow differentiation among the different strains isolated from a same bloom (Table 2).
A very interesting result was that the lectin-binding pattern and toxin production was related. Lectins are found to be useful tools for differentiating clones of M. aeruginosa between toxic and non-toxic strains within a pool of 35 different clones isolated from four different blooms (with a great variety in toxin production). In this sense, lectin from Ulex europaeus (UEA-1) showed the most important result: all non-toxic M. aeruginosa strains were positively binding with UEA-1 lectin. Contrarily, lectin from Canavalia ensiformis (ConA) was able to bind to all clones except the three most toxic (MaD7, MaG8 and MaD1). The other six lectins used in this study demonstrated non-significant affinities to discriminate between toxic or non-toxic clones.
The results reported here indicated that the most toxic strains were labelled by very few lectins. In contrast, non-toxic strains were tagged by numerous strains of lectins. Statistically significant regression was found between toxin production (in fg microcystin LR-equivalent per cell) and the number of lectin that positively label the strain (slope ± se = -0.0434 ± 0.0044; correlation coefficient r = -0. 8677; P<0.001).
A hierarchical cluster analysis showed three differentiated alignments (Figure 2). These alignments were directly related with the toxin production of each strain. In short, all the non-toxic strains were included in the first alignment. The strains with a moderate microcystin production (from 0.02 to 0.17 µg microcystin LR equivalent) were integrated in the second alignment. Finally, the four strains with higher microcystin production (more than 25 µg) are included in the third alignment.
In an attempt to raise the knowledge and test whether this discrimination procedure could also works in field samples, the percentage of M. aeruginosa colonies negatively labelled by UEA-1 lectin and the water toxicity of each bloom sample were studied. The blooms with less amount of microcystin showed the highest percentage of M. aeruginosa colonies positively labelled by UEA-1 lectin (Table 3). In contrast, the blooms with higher amount of microcystin exhibited the lowest percentage of UEA-1 labelled colonies.
Table 3.- Relation between the percentage of M. aeruginosa colonies negatively labelled by UEA-1 lectin from each bloom and the water toxicity observed in each blooms.
Bloom from |
% of colonies with negative label by UEA-1 lectin (microcystin-produccing) |
Water toxicity (in µg/L microcystin LR equivalent) |
El Gergal |
9% |
0.4 |
La Minilla |
4% |
0.1 |
Cuerda del Pozo |
29% |
1.9 |
Doñana National Park |
63% |
4.3 |
4. DISCUSSION
During the last decades numerous fields of microbiology have been increased use of lectins. The interactions of lectins with microorganisms have been widely applied for the examining of bacteria and protists (47).
Despite little is known about the biological function of lectins in cyanobacteria. Apparently, Microcystis lectins seem to play a role in cell-cell recognition and aggregation of single cells to colonies (58). There also appears to be a functional association between microcystin production and lectins. In particular, microcystin has an impact on the expression of MNV lectin of Microcystis (58).
Despite of our lack of knowledge about numerous details concerning the biological function of lectins in cyanobacteria, the property of lectins to bind non-covalently to simple sugar and polysaccharides could be a practical method to discriminate among different cyanobacteria strains as well as to discriminate between toxin-produccing and non-toxic M. aeruginosa strains. Ever since Costas and López-Rodas (1994) (48), the importance of lectins distinguish toxic and non-toxic PSP-producing strains of marine dinoflagellates is well known, despite biological function of lectins in toxic dinoflagellates was not completely elucidated at this moment. Despite the promising results obtained from the use of lectins differing clones of cyanobacteria, this procedure is not currently a routine technique in water supply enterprises (56, 57).
Several works characterizing lectin-binding pattern show that M. aeruginosa strains differ in their surfaces properties (59-61). It has been observed that M. aeruginosa populations could comprise large clonal families, anywhere from a few to a hundred strains, differing in a wide range of properties. Since asexual reproduction prevails with blooms, clones of ancient divergence can be quite different from one another due to mutations, selection, chance and history (reviewed in 62, 63). Little is known about the inheritance of these cell surface glycans, which are lectin-binding sites in cyanobacteria, although apparently these glycans show genetic polymorphism and Mendelian inheritance in algae (56). Moreover, strains of ancient divergence apparently show more differences for a lectin-binding pattern that clones of contemporary divergence (56, 64).
After analyzing four distinct blooms, differences in the lectin-binding patterns were found among the diverse strains isolated from a same bloom as well as among the different colonies directly analysed from the same water samples. In this context, this would demonstrate that M. aeruginosa blooms are constituted by different strains that differ in composition of cell surface glycans.
From a practical point of view, the most relevant question is elucidating the relationship between microcystin production and lectin-binding pattern. It is well establish that not all M. aeruginosa cells of a bloom are toxic and cell density cannot be directly related to toxicity. Thus, it would be extremely useful to identify the abundance of toxic cells in a bloom during routine observation of phytoplankton under microscopy that performs most of water supply enterprises, since the visual examination of lectin-binding activity by optical staining quality is a rapid, straightforward and easy method to differentiate M. aeruginosa strains. This method could provide an operative typing of M. aeruginosa colonies directly collected from the environment.
A significant regression between toxin production and the number of lectin was observed, suggesting that positively lectins-labelled could be a promising way to discriminate between toxic and non-toxic M. aeruginosa cells. Since, the most toxic strains are labelled by very few lectins whereas non-toxic strains are labelled by the most of lectins. Thus, it could be assumed that the absence of lectins that label the three most toxic strains indicates a scarce presence of lectin binding sites in the most toxic M. aeruginosa strains.
Previous studies have characterized morphospecies and strains of Microcystis sp. using lectins (56); however, they did not show the important relationships between lectin-binding pattern and microcystin production. Hierarchical cluster analysis (Figure 1) reveals that lectin-binding pattern of each strain is close related to its microcystin production. Lectin-binding pattern classify the different strains into three different alignments. Firstly, the four strains with higher microcystin production are separated and next separating non-toxic from moderately toxin-producing strains. Taking into account only one strain appears incorrectly aligned strengh of this alignment is evident.
UEA-1 lectin seems to be specific enough to bind only to non-toxic M. aeruginosa cells. Figure 2 shows the lectin binding activity observed using an epi-fluorescence microscope. Colonies positive for lectin binding showed intense green fluorescence on the cell surface (thin arrows) as well as on inter-cellular matrix (wide arrows) non-toxic M. aeruginosa cells. This procedure is extremely useful to identify the abundance of toxic cells in a bloom. It as easy as collected a single water sample directly from a bloom and make a rapid staining procedure and a straightforward observation under an epi-fluorescence microscope is sufficient. With this experimental procedure we were able to successfully separate non toxic and toxic M. aeruginosa strains in several water samples from different blooms. As a rule, a larger amount of microcystin indicates more percentage of unmarked colonies by UEA-1 lectin.
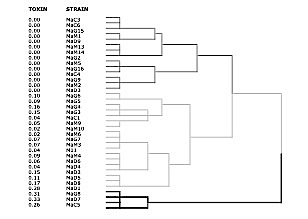
Figure 1.- Hierarchical cluster analysis (dendrogram using a binary average linkage). (MaD- strains from a bloom in Doñana National Park; MaG- strains from bloom in water supply reservoir of El Gergal; MaM- strain from a bloom in water supply reservoir of La Minilla.; MaC- strain from a bloom in water supply reservoir of Cuerda del Pozo. Toxin production of each strain (in fg microcystin-LR equivalent per cell) is also summarized.
In this study, 8 lectins and 35 strains from four M. aeruginosa blooms from a restricted geographical range (Spain) were used. Although this work, to the best of our knowledge, is the most extensive lectin-binding study performed on M. aeruginosa (by number of lectins, strains, blooms and field samples analysed) is a work limited to M. aeruginosa blooms from Spain. Spain is the second biggest European country (and the country with more problems caused for M. aeruginosa blooms). Important Spanish water supply enterprises as well as the toxin cyanobacteria-monitoring program of Doñana National Park (which support more than 85% of water-birds European biodiversity) are successfully using this procedure. However, the Microcystis problem is a global problem that implicates other Microcystis species (i.e. M. viridis, M. wesenbergii, M. floos-aquae, with scarce occurrence in Spain) as well as other countless unstudied M. aeruginosa strains from American, Australian, Asia and Africa. Consequently, more work is necessary, mainly analyzing many Microcystis samples from different geographical origin to assure that lectins are a single procedure that can universally differentiate toxic and non-toxic Microcystis cells. Finally, these results could lead to affirm that lectin-labeling seems to be a hopeful method for the aforementioned procedures.
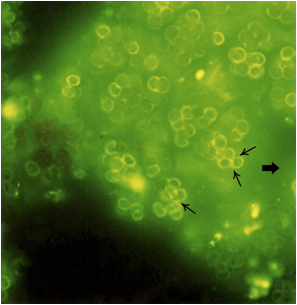
Figure 2.- Lectin binding activity observed using epi-fluorescence microscopy. Positive colonies for lectin binding showed intense green fluorescence on the cell surface (thin arrows), as well as on the inter-cellular matrix (wide arrow).
From an ecological point of view, it has been showed that lectin-binding pattern confirms that each M aeruginosa bloom is composed by different strains. Toxic and non-toxic strains occur together in the same bloom. The blooms with less amount of microcystin show high percentage of non-toxic M. aeruginosa colonies positively labelled by UEA-1 lectin. In contrast, the blooms with a greater more quantity of microcystin show a low percentage of non-toxic M. aeruginosa colonies. As such, lectins seem to be useful tools for analysing changes in the density of toxic and non-toxic colonies over time during the developmental, stationary phase and collapse within the same bloom.
5. CONCLUSIONS
1.- The optical examination of the lectin-binding pattern observed under a fluorescence microscope is rapid assay that allows an operative typing of M. aeruginosa colonies directly collected from the environment or from cultures.
2.- The lectin-binding pattern allows differentiating among M. aeruginosa strains with a great variety in toxin production isolated from different blooms. All the M. aeruginosa colonies from the same strain (as well as all the cells of the same colony) showed similar labeling. This lectin-binding pattern of each strain is close related with its microcystin production. A cluster classified based on lectin binding pattern separates M. aeruginosa strains into three different groups: non-toxic, moderate toxicity and high toxicity.
3.- Non-toxic M. aeruginosa strains were positively bound with UEA-1 lectin. In contrast, the most toxic strains remain unbound. This procedure also was successful in field samples from M. aeruginosa blooms.
6. ACKNOWLEDGEMENTNS
This work has by been financially supported by the Spanish Ministry of Sciences and Innovation through the grants CTM2008- 05680 C02-01/MAR and CGL2008-00652/BOS. Authors thank the financial support given the project CENIT-VIDA and by the Ministerio de Educación y Ciencia, through FPU program. Special thanks are given Lara de Miguel Fernandez by technical support
7. REFERENCES
1. Skulberg, O.M.; Carmichael, W.W.; Codd, G.A.; Skulberg, R.; In Falconer, I.R. Ed.; Academic Press, London, 1993; p. 145.
2. Gorham, P.R.; Carmichael, W.W.; In Algae and human affairs. Lembi, C.A., Waaland, J.R., Eds.; Cambridge, 1988; p. 403.
3. Carmichael, W.W. (1992). J. of Appl. Microb., 72, 445.
4. Park, H.D.; Bomchul K.; Enkyong Kim.; & T. Okino. (1998). Environ. Toxicol. Water. Qual., 13, 225.
5. Billings, W. H.; In The Water Environment: Algal Toxins and Health. Carmichael W. W.; Ed.; New York 1981; p. 243
6. Falconer, I. R. (1989). Toxicity Assessment, 4,175.
7. Jochimsen, E.M.; Carmichael, W.W.; An, J.; Cardo, D.M.; Cookson, S.T.; Holmes, C.M.D.; Antunes, M.B.D.; De-Melo, D.A.; Lyra, T.M.; Barreto, V.S.T.; Azevedo, S.M.F.O.; & Jarvis, W.R. (1998). N. Engl. J. Med., 338, 873.
8. Zhang, D.W.; Xie, P.; Liu, Y.Q.; Chen, J.; & Liang, G.D. (2007). Environ. Toxicol. Chem., 26, 171.
9. Zhang, D.W.; Xie, P.; Liu, Y.Q.; & Qiu, T. Sci. Total Environ., 407, 2191.
10. Chen, J.; Xie, P. (2005). Environ. Toxicol., 20, 572.
11. Martínez, J.; López-Rodas, V.; & Costas, E. (2009). Med. Hypotheses, 72, 539.
12. World Health Organization; Guidelines for Drinking Water Quality (W.H.O., Geneva), 1998, 2nd Ed.
13. Matsunaga, H.; Harada, K.I.; Senma, M.; Ito, Y.; Yasuda, N.; Ushida, S.A.; & Kimura, Y. (1999). Nat. Toxins, 7, 81.
14. Alonso-Andicoberry, C.; García-Villada, L.; López-Rodas, V.; & Costas E. (2002). Vet. Rec., 151, 706.
15. Carmichael, W.W.; & Hui, R. (2006). Saline Systems, 2, 5.
16. López-Rodas, V.; Maneiro, E.; Lanzarot, M.P.; Perdigones, N.; & Costas, E. (2008). Vet. Rec., 162, 317.
17. Carmichael, W.W.; Azevedo, S.M.F.O.; An, J.; Molica, R.J.R.; Jochimsen, E.M.; Lau, S.; Rinehart, K.L.; Shaw, G.R.; & Eaglesham, G.K. (2001). Environ. Health Perspect., 109, 663.
18. Codd, G.A.; Bell, S.G.; Kaya, K.; Ward, C.J.; Beattie, K.A.; & Metcalf, J.S. (1999) Eur. J. Phycol., 34, 405.
19. Pouria, S.; de Andrade, A.; Barbosa, J.; Cavalcanti, R.L.; Barreto, V.T.; Ward, C.J.; Preiser, W.; Poon, G.K.; Neild, G.H.; & Codd, G.A. (1998). Lancet, 352, 21.
20. Sivonen, K.; Jones, G.; In Cyanobacterial toxins; Chorus, I.; Bartram, J.; Eds.; Routledge; London, 1999; p 41.
21. Tillet, D.; Dittmann, E.; Erherd, M.; von Dohren, H.; Borner, T.; Neilan, B.A.; Chem. Biol. 2000, 7, 753.
22. Runnegar, M.T.; Kong, S.; & Berndt, N. (1993). Am. J. Physiol., 265, 224.
23. Jacoby, J.M.; Collier, D.C.; Welch, E.B.; Hardy, E.J.; & Crayton, M. (2000). Can. J. Fish. Aquat. Sci., 57, 231.
24. Kaebernick, M.; & Neilan, B.A. (2001). FEMS Microbiol. Ecol., 35, 1.
25. Kurmayer, R.; Dittmann, E.; Fastner, J.; & Chorus, I. (2002). Microb. Ecol., 43, 107.
26. Dittmann, E.; & Börner, T. (2005). Toxicol. Appl. Pharmacol., 203, 192.
27. Shirai, M.; Ohtake, A.; Sano, T.; Matsumoto, S.; Sakamoto, T.; Sato, A.; Aida, T.; Harada, K.I.; Shimada, T.; Suzuki, M.; & Nakano, M. (1991). Appl. Environ. Microbiol., 57, 1241.
28. Vezie, C.; Brient, L.; Sivonen, K.; Lefeuvre, J.C.; & Salkinoja-Salonen, M. (1998). Microb. Ecol., 35, 126.
29. Carrillo, E.; Ferrero, L.M.; Alonso-Andicoberry, C.; Basanta, A.; Martín, A.; López-Rodas, V.; & Costas, E. (2003). Phycologia, 42, 269.
30. Martín, A.; Carrillo, E.; & Costas, E. (2004). Limnética, 23, 153.
31. Nishizawa, T.; Ueda, A.; Asayama, M.; Fujii, K.; Harada, K.-I.; Ochi, K.; & Shirai, M. (2000). J. Biochem., 126, 779.
32. Meibner, K.; Dittmann, E.; & Börner, T. (1996). FEMS Microbiol. Lett., 135, 295.
33. Kotak, B.G.; Lam, A.K.Y.; Prepas, E.E.; & Hrudey, S.E. (2000). Can. J. Fish. Aquat. Sci., 57, 1584.
34. López-Rodas, V.; Costas, E.; Bañares, E.; García-Villada, L.; Altamirano, M.; Rico, M.; Salgado, C.; & Flores-Moya, A. (2006). Phycologia, 45, 243.
35. Rico, M.; Altamirano, M., López-Rodas, V., & Costas, E. (2006). Phycologia, 45, 237.
36. Bañares-España, E., López-Rodas, V., Salgado, C., Costas, E., & Flores-Moya, A. (2006). Aquat. Bot., 85, 159.
37. Bañares-España, E.; López-Rodas, V.; Costas, V.; Salgado C.; & Flores-Moya, A. (2007). FEMS Microbiol. Ecol., 60, 449.
38. Janse, I.; Meima, M.; Kardinaal, W.E.A.; & Zwart, G. (2003). Appl. Environ. Microbiol., 69, 6634.
39. Pan, H.; Song, L.; Liu, Y.; & Börner, T. (2002). Arch. Microbiol., 178, 421.
40. Hisbergues, M.; Christiansen, G.; Rouhianen, L; Sivonen, K.; & Börner, T. (2003). Archiv. Microbiol., 180, 402.
41. Janse, I.; Kardinaal, W.E.A.; Meima, M.; Fastner, J.; Visser, P.M.; & Zwart, G. (2004). Appl. Environ. Microbiol., 70, 39979.
42. European Parliament. Directive 2000/60/EC of the European Parliament and of the Council of 23 October 2000 establishing a framework for Community action in the field of water policy.
43. Goldstein, I.J.; Hughes, R.C.; Monsigny, M.; Osawaand, T.; & Sharon, N. (1980). Nature, 285, 66.
44. Pistole, T.G. (1981). Interaction of bacteria and fungi with lectins and lectin-like substances. Annu. Rev. Microbiol., 35, 85-112.
45. Wu, A.M.; Sugii, S.; & Herp, A. (1988). Adv. Exp. Med. Biol., 228, 819.
46. Sharon, N.; & Lis, H. (1989). Science, 246, 227.
47. Slifkin, M.; & Doyle, R.J. (1990). Clin. Microbiol. Rev., 3, 197.
48. Costas, E.; & López-Rodas, V. (1994). J. Phycol., 30, 987.
49. Fritz, L. (1992). Korean J. Phycol., 7, 319.
50. Costas, E.; González- Chavarri, E.; Aguilera, A.; González-Gil, S.; & López-Rodas, V. (1993). Bot. Mar., 36, 1.
51. Cho, E.S. (2003). J. Plankton Res., 25, 309.
52. Rhodes, L.L.; Haywood, A.J.; & Fountain, D.W. (1995). N. Z. J. Mar. Freshw. Res., 32, 537.
53. Cho, E.S.; & Costas, E. (2004). J. Plankton Res., 26, 175.
54. Cho, E.S.; Hur, H.J.; Byun, H.S.; Lee, S.G.; Rhodes, L.L.; Jeong, C.S.; & Park, J.G. (2002). Bot. Mar., 45, 346.
55. Álvarez, M.J.; Basanta, A.; López-Rodas, V.; Costas, E.; In: Harmful algae Reguera, B.; Blanco, J.; Fernández, M.L.; Wyatt, T.; Eds.; París, 1998; p 291.
56. López-Rodas, V.; & Costas, E. (1997). J. Phycol., 33, 446.
57. González-Gil, S.; Aguilera, A.; López-Rodas, V.; & Costas, E. (1999). Eur. J. Phycol., 34, 27.
58. Kehr, J.C.; Zilliges, Y.; Springer, A.; Disney, M.D.; & Ratner, D.D. (2006). Mol. Microbiol., 59, 893.
59. Yamaguchi, M.; Ogawa, T.; Muramoto, K.; Kamio, Y.; Jimbo, M.; & Kamiya, H. (1999). Biochem. Biophys. Res. Commun., 265, 703.
60. Jimbo, M.; Yamaguchi, M.; Muramoto, K.; & Kamiya, H. (2000). Biochem. Biophys. Res. Commun., 273, 499.
61. Bewley, C.A.; Cai, M.; Ray, S.; Ghirlando, R.; Yamaguchi, M.; & Muramoto, K. (2004). J. Mol. Biol., 339, 901.
62. Costas, E. (1999). Genetica, 1990, 83, 99.
63. Flores-Moya, A.; Costas, E.; & López-Rodas, V. (2008). Naturwissenschaften, 95, 697.
64. Costas, E.; Zardoya, R.; Bautista, J.; Garrido, A.; Rojo, C.; & López-Rodas, V. (1995). J. Phycol., 31, 801.